The demand curve represents the relationship between the quantity of a good that consumers are willing to purchase and the price of the good. We can represent this relationship as,
Qd = Qd(P)
Now have a look at the below figure, we can see that the demand curve D slopes downward. Consumers buy more goods if the price is lower. Apart from price, the quantity of goods that consumers are willing to purchase depends on other factors too. The most important thing is Income. With higher incomes, consumers tend to spend more money to buy more goods.
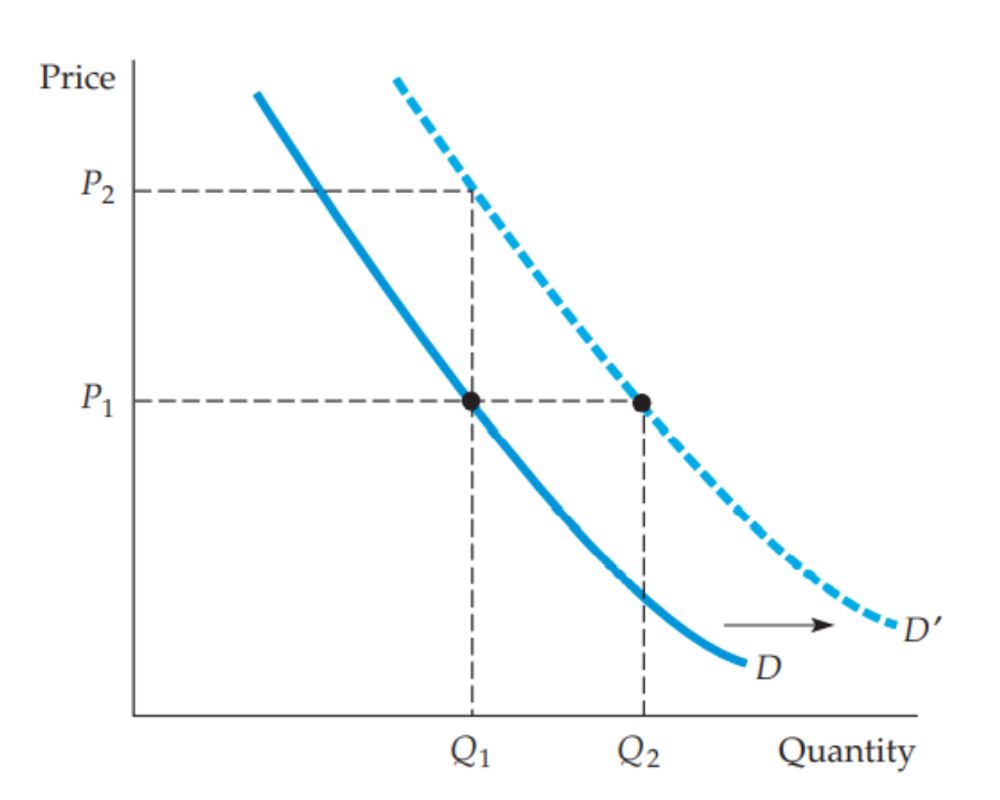
Shifting in demand curve: Let's see what happens when income increases. Note the graph, if market price is held constant at P1, we can see the increase in quantity demanded from Q1 to Q2, which is due to consumer's higher incomes. This would happen no matter what the market price, thus resulting in the shift of entire demand curve to the right. Also, we can ask what price consumers are willing to pay to purchase a given quantity Q1. With greater income, consumers are willing to pay a greater price P2 instead of P1 as shown in the figure. Again, the demand curve shifts to right.
Thus the phrase change in demand refers to shift in the demand curve and the phrase change in quantity demanded refers to movements along the demand curve.
Changes in the price of related goods also affect demand. Goods are substitutes when an increase in the price of one leads to an increase in the quantity demanded for the other. For example, beef and chicken are substitutes because when price changes most consumers are willing to shift their purchase from one to the other.
Goods are complements when an increase in the price of one leads to a decrease in the quantity demanded for the other. For example, automobiles and gasoline are complementary goods. When gasoline price decreases, it leads to an increase in the quantity demanded for automobiles. The shift in the demand curve could also have resulted from either the increase in the price of a substitute good or a decrease in the price of a complementary good.
I hope you guys must have a clear understanding of the concept of demand curve. We will discuss more microeconomics concepts in the upcoming blogs. Please stay tuned for my next blog. Thank you for your time. Please leave your thoughts in the comment box. Thank you!