Everyone in the trading world strives for good returns. Isn’t it? And more importantly- Consistency. I have discovered one trading strategy which can provide decent returns consistently.
The strategy is based on Pivot Based Exponential Moving Average (PEMA) and is applied on Nifty index futures. PEMA was popularized by Frank Ochoa. He has also published a free ebook on PEMA study on his site. I have added a bit of price action on this indicator to get good entries. I backtested this strategy for the starting 3 months of this year viz. Jan’21- Mar’21 and it generated on an average 990points per month. Let’s say the margin required for intraday Nifty futures is ~Rs. 1.5lacs. Nifty current lot is 75. So the profit per month is 990 multiplied by 75 viz. Rs. 74,250/-. This is a whopping 49% return in a month. Of course not every month you will get this return. I did live trading in Apr’21 and fetched 178points viz. ~8% return and in May’21 almost flat (no profit no loss). But still in good profit for Year to date. Below is the description of the strategy.
EMAs used - 8, 13 and 21 based on standard pivots
Timeframe- 5 minutes
Scrip- Nifty Index
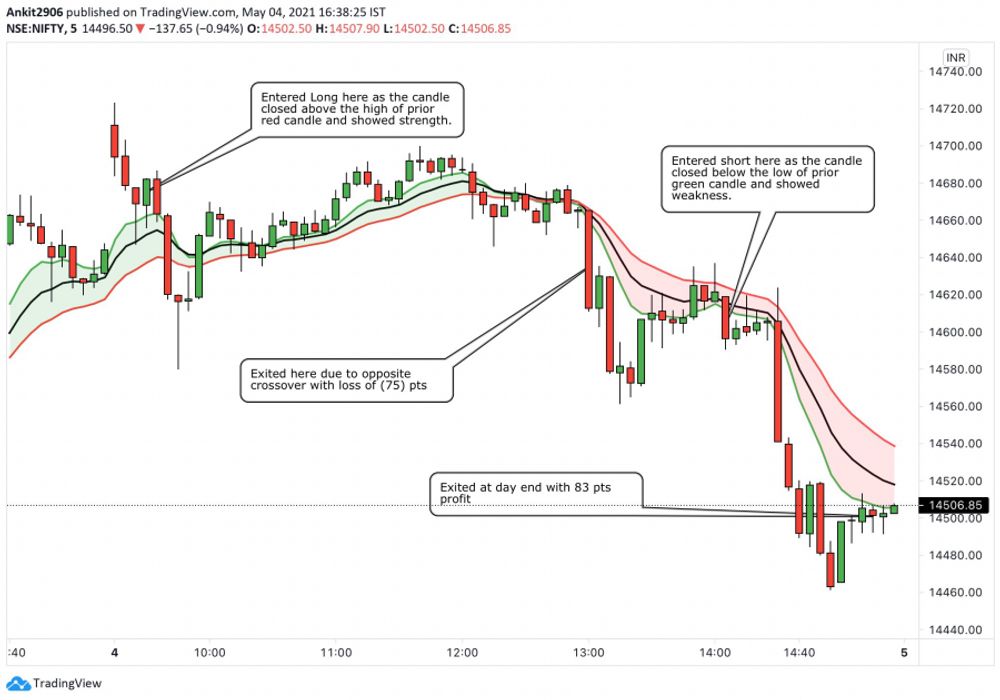
Plot- Whenever fast moving PEMA (8) crosses medium (13) and slow (21) PEMA and the averages are stacked and sloped then look for entry opportunities. Entry can be made immediately on crossover or once the price pulls back again to PEMA. Once entered, the exit can be day end or opposite crossover happens whichever is earlier.
Also, when entering look for the strength of the candle if buying or weakness if shorting. Green candle with no upper wicks are strong and Red candle with no lower wicks show weakness.
Please see below the example of the above strategy in action. I will post more examples in my follow up blog for more understanding.
In the Chart below, you can see faster PEMA (8- green line) is above medium PEMA (13- black line) and slow PEMA (21- red line). We should look for buy opportunities. The lines are sloped and stacked as well. When the price pulls back to lines and if the candle shows strength there, we should buy.
Disclaimer: Please note that this post is for educational purpose and not to be construed as trading advice. Please consult your financial advisor before taking any decisions on investment or trading.