The basic model of supply and demand is the factotum of microeconomics. It helps us to understand price fluctuations and results when the government interferes in a market. The two essential concepts of the supply-demand model: a supply curve and a demand curve. Let's discuss these concepts more precisely.
The Supply Curve shows the relationship between the quantity of a good that producers are willing to sell and the price of the good, holding constant any other factors that might affect the quantity supplied. The curve labeled S in the below figure represents this. The horizontal axis represents the quantity supplied Q (units per period) and the vertical axis represents the price of a good P (dollars per unit). We can write the equation as,
Qs = Qs(P)
The Supply curve slopes upward showing that the higher the price, the more that firms are willing to produce and sell. The higher price also attracts new firms into the market. If production costs fall, firms can produce the same quantity at a lower price and a larger quantity at the same price. Then the supply curve shifts to the right from S to S'.
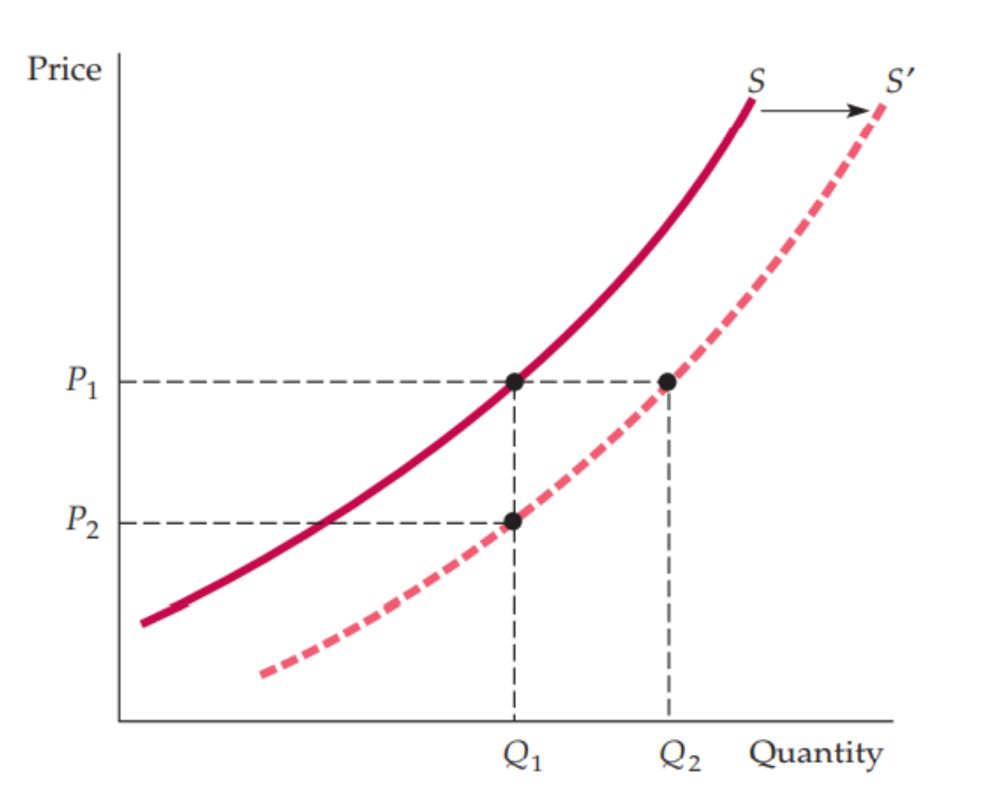
Apart from price, there are other variables that affect supply. They are production costs, labor wages, cost of raw materials, and interest charges. A change in one or more of these variables causes a shift in the supply curve. The Supply curve S in the above graph represents at a Price P1, the quantity supplied and sold would be Q1. Now suppose if the cost of raw materials falls, what happens to the supply curve?
Lower raw materials costs, make production more profitable, thus encouraging firms to expand their production and inviting new firms to the market. If at the same time, the market price stays constant at P1, then we can expect a larger quantity supplied, the graph shows this as an increase from Q1 to Q2. When production costs are lower, output raises no matter what the market price would be. The whole supply curve thus shifts to the right from S to S' as shown in the above graph.
Another effect of the fall in raw material costs is that the quantity produced stays in Q1 and then what price the firms would require to produce this quantity. As the costs are lower, firms would accept the lower price P2, no matter what quantity was produced. Again we can see the supply curve must shift to the right.
Thus the phrase change in supply means shifts in the supply curve and the phrase change in quantity supplied means movements along the supply curve.
The demand curve explanation is coming up in my next blog. Please stay tuned for my next blog. Thank you!